Managing Emotional Pain in Loss and Grief: Waves, Floors, and the Cost of Numbing
Edited with AI About this label
This version was adapted, rewritten, or refined with AI assistance from existing source material and/or human editorial input. Deep Emotional Work Academy retains editorial responsibility.
By Matthias Behrends
Review & Opinion
TL;DR
- The charts: Three schematic charts of emotional pain after a loss on a 0 to 10 scale: the typical course over twelve months, the course of complicated grief, and what numbing substances such as alcohol do to both. They are models drawn to be argued with, not measurements.
- What is established: Grief comes in waves. In a typical course the floor between waves eases over the year while the waves stay strong and come less often. In complicated grief, now called prolonged grief disorder, the floor stays high and the waves stay frequent. The first weeks look the same in both.
- The hypothesis: Numbing a wave buys a short dip in pain, is followed by a rebound, and stalls the easing of the floor. In complicated grief the floor drifts higher and dependency risk grows on top of the grief.
- The evidence: The association between substance misuse and complicated grief is established, and avoidance predicts prolonged grief in the first year. The rebound after alcohol is real but modest. The rising floor with repeated use is theory in humans. No study has measured grief trajectories in drinkers versus non-drinkers.
- The practice: Expect waves and do not read them as setbacks. Alternate on purpose between facing the loss and living. Rate the pain once a day for six weeks. Watch for the dip and spike pattern. Ask for an assessment if the floor has not eased at six to twelve months.
- Conclusion: Managing the pain of loss means managing the floor, not the waves. Numbing works on the waves and costs the floor. We invite experienced people to correct the curves.
Grief does not fade in a straight line. It comes in waves, and the waves stay strong long after the floor between them has dropped. That one fact explains most of what people get wrong about the pain of loss, including why a drink every evening feels like it helps and why the help does not last.
This article puts the pattern into three charts and then asks how solid they are. Nobody measured these curves in a study. They are drawn from the established models of acute and integrated grief, from the diagnostic time thresholds for prolonged grief, and from what bereaved people describe. They are published to be corrected by people who have sat with grief for years, professionally or in their own lives.
Manage the floor, not the waves. Numbing works on the waves and costs the floor.
1. How to read the scale
Pain is rated from 0 to 10, the same kind of scale used for physical pain. 0 is no pain. 10 is the worst pain imaginable. People can rate their own grief on this scale once a day in under a minute, and doing so for a few weeks makes three things visible in their own life: the floor between waves, the height of the waves, and how often the waves come.
The Academy's article on emotional pain sets out why pain carries information and why re-experiencing it is not automatically processing it. This article adds the time course.
The charts show two courses. Typical grief is the course most bereaved people follow, with wide individual variation. Complicated grief is the older name for what ICD-11 and DSM-5-TR now call prolonged grief disorder: a course in which intense grief persists well beyond cultural norms, with distress or impairment that does not ease. The diagnosis requires more than duration or intensity. It requires clinically significant distress or functional impairment and a response that exceeds relevant cultural, social, or religious norms. A chart cannot make that judgment. A clinician can.
2. Chart 1: the shape of grief over a year
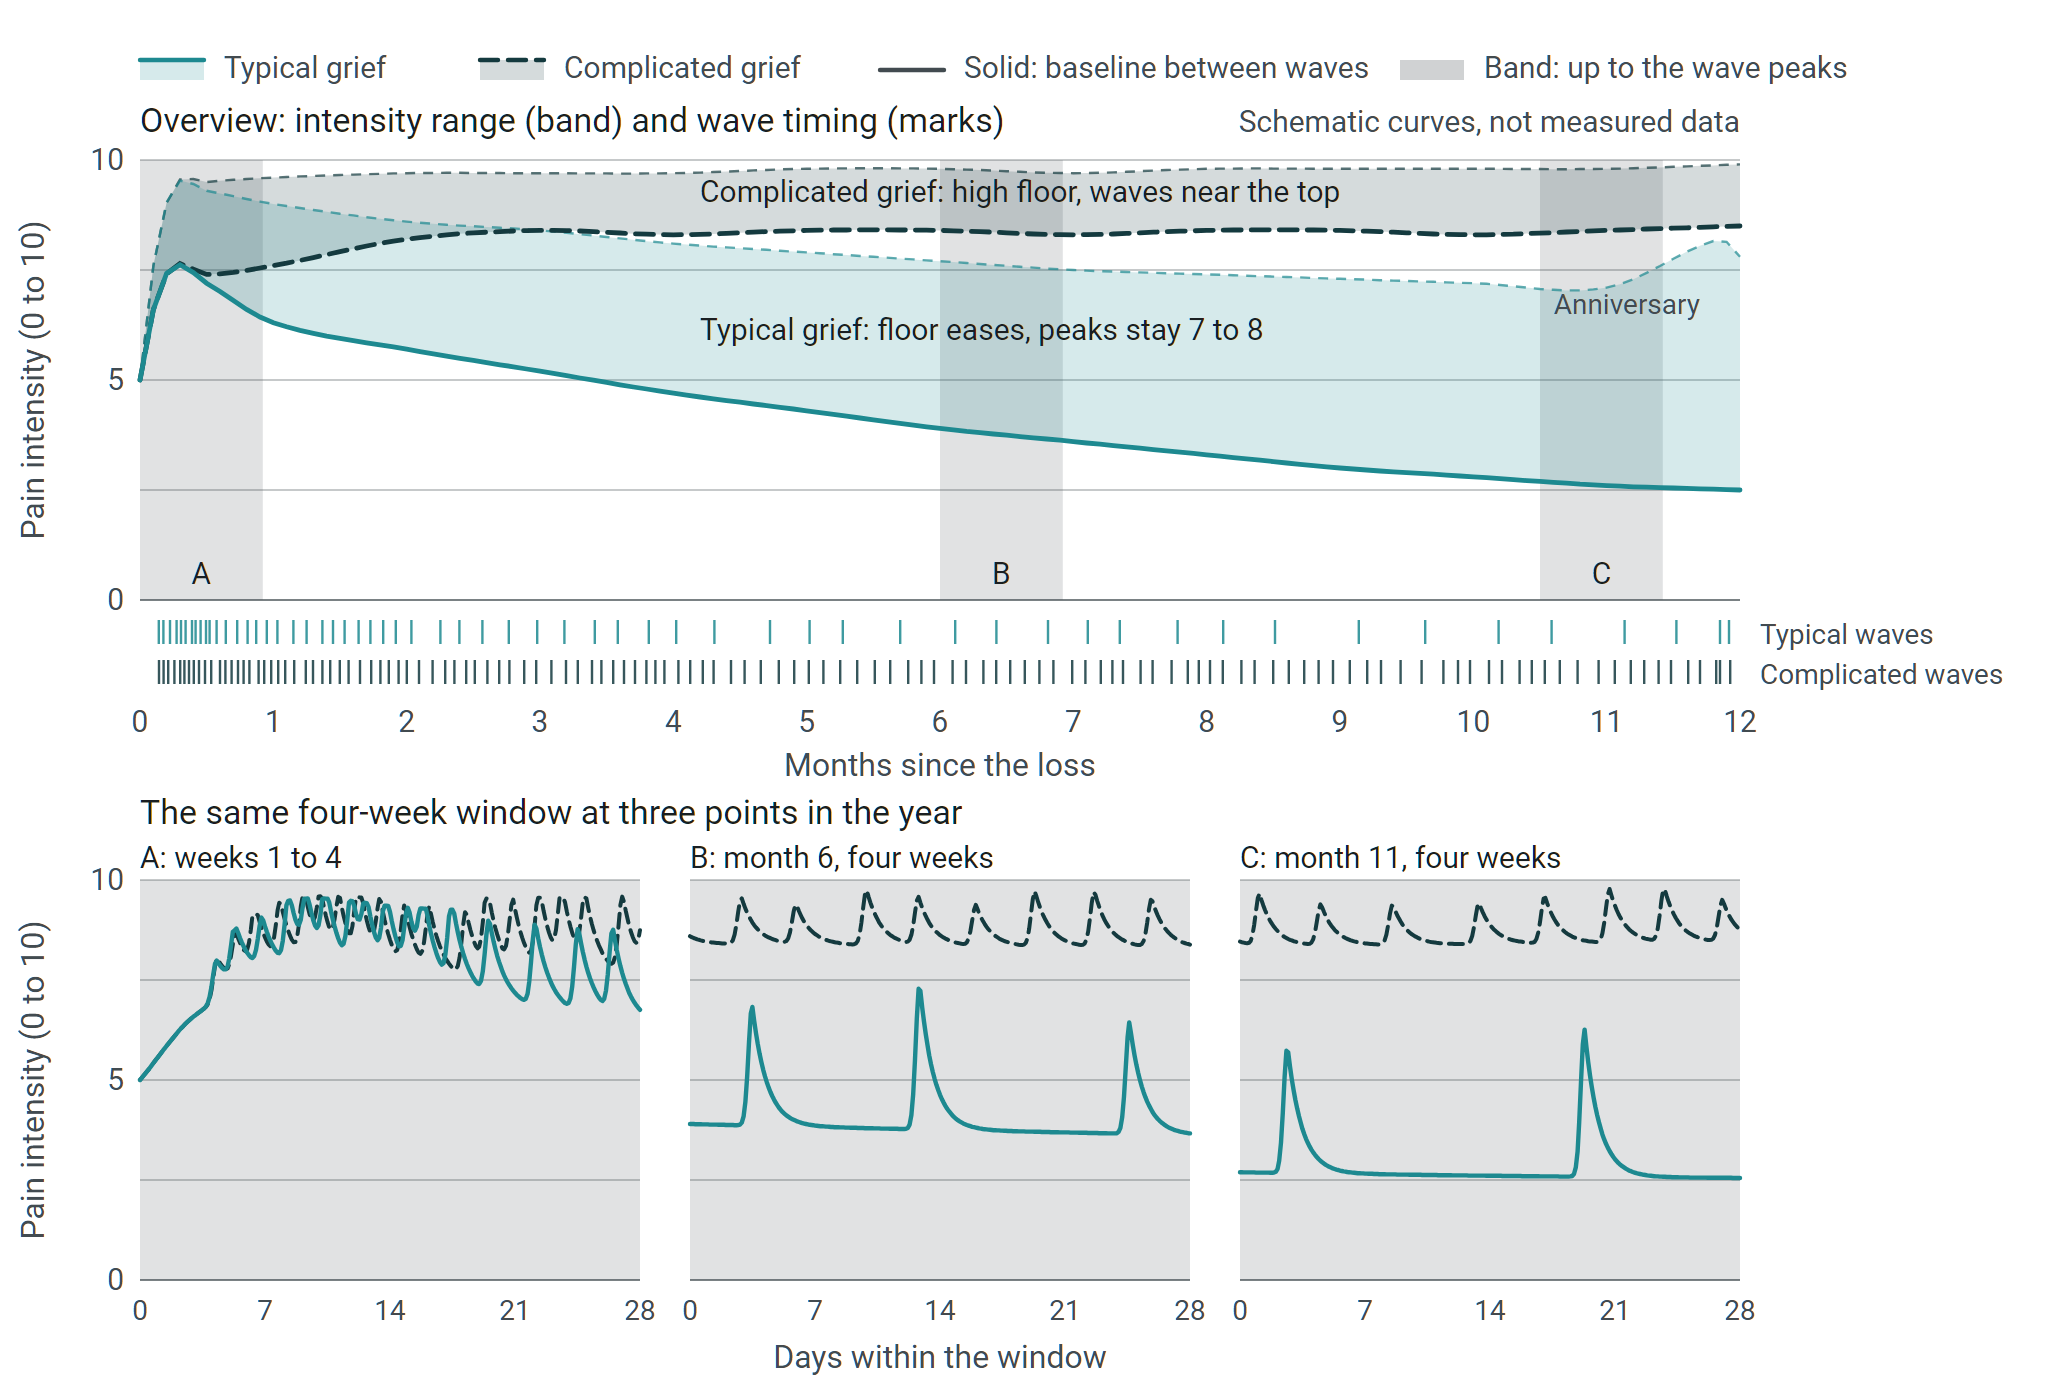
The top panel shows a band for each course. The lower edge is the floor, the pain that remains between waves. The upper edge is where the waves peak. The marks underneath show when waves happen. The three small panels below repeat the same four-week window at three points in the year, so individual waves can be seen at the same scale.
Typical grief looks like this:
- The first days bring shock and numbness. The rating often sits at 5 or 6, not 10, because the mind has not yet let the loss fully in.
- The first weeks bring almost daily waves near the top of the scale, on a floor that is itself high. Nothing distinguishes a typical course from a complicated one at this stage.
- Over the months the floor eases, from around 6 at month one to around 2 or 3 at month twelve. The waves come less often: roughly weekly by month three, every few weeks by the end of the year. But the waves themselves stay strong. A wave in month nine can still reach 7 or 8. Birthdays, songs, a smell, an empty chair, and above all the first anniversary bring them back.
Complicated grief looks different:
- The first weeks are the same.
- The floor does not ease. It stays around 8, month after month.
- The waves stay frequent and reach the top of the scale all year.
The diagnostic time thresholds sit at six months after the loss in ICD-11 and twelve months in DSM-5-TR. The point of the thresholds is not that grief should be finished by then. It is that a floor which has not eased at all by then deserves a professional assessment.
One caution about the picture. Grief is individual. Some people never have a high floor. Some have a low floor and rare but violent waves. The curves show a common pattern, not a norm to measure yourself against.
3. Chart 2: what numbing substances do to the curve
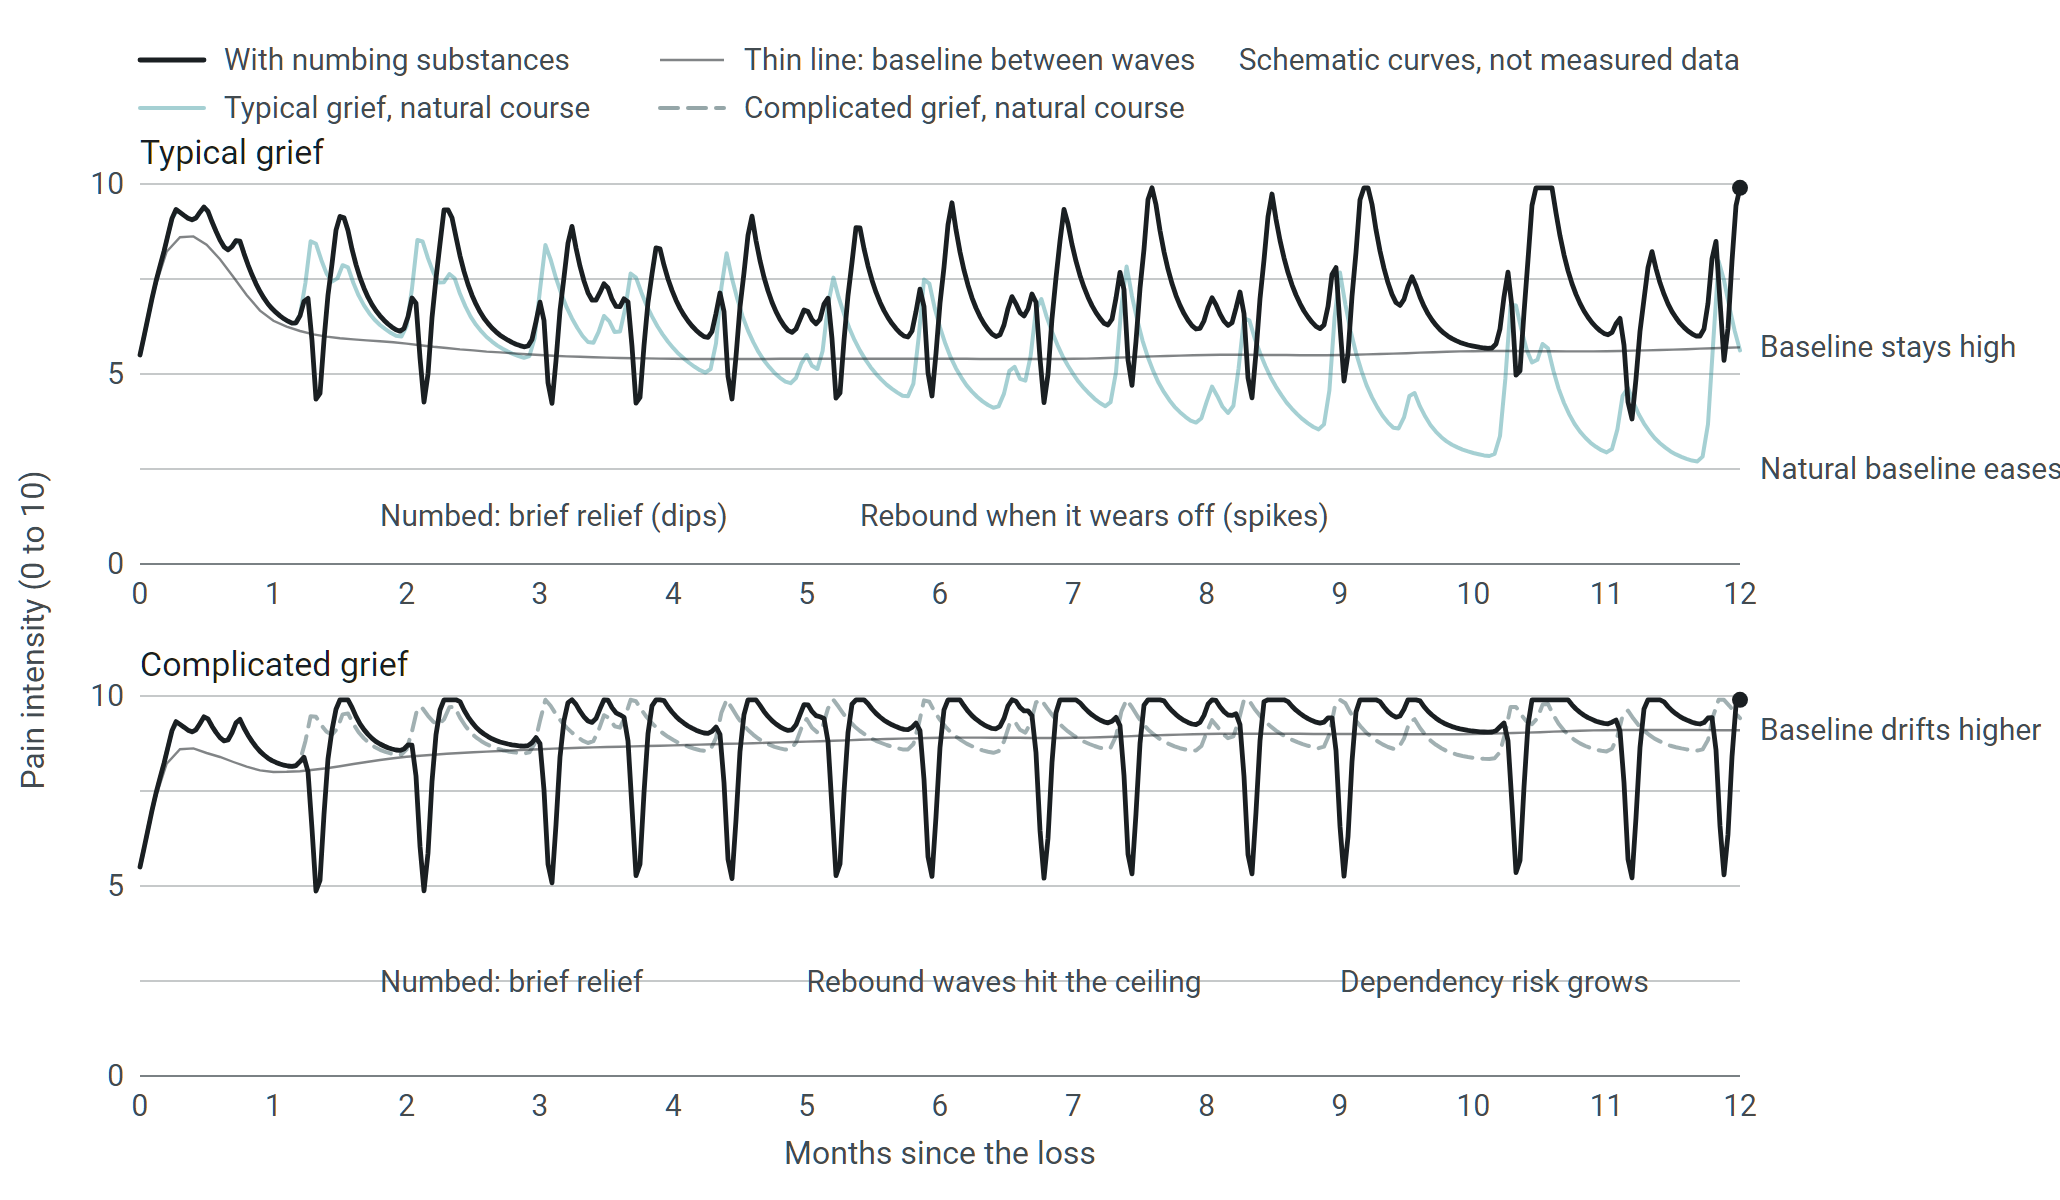
Alcohol, sedatives, cannabis, and other numbing substances act on the waves. The chart models what happens when someone reaches for a substance whenever a big wave comes.
- The dip is real. In the moment, the felt pain drops, often below the natural floor. This is the relief people describe, and it is why the habit forms.
- The spike follows. When the substance wears off, the suppressed wave comes back, and in the model it comes back larger. Over the year the rebounds grow.
- The floor stops easing. In the typical course the natural floor sinks toward 2 or 3. In the numbed course it stalls around 5 or 6. The pain is deferred, not reduced, because the avoidance blocks the slow work by which the loss becomes part of life.
- In complicated grief the floor drifts higher, toward 9, and dependency risk grows on top of the grief.
4. How solid is chart 2?
The evidence was checked before publication. Parts of the chart are well supported, one part is theory, and the whole curve is an inference. Here is the state of the evidence as found.
- Substance misuse and complicated grief go together. A systematic review of twelve studies found the relationship runs both ways: prior or escalating substance use raises the risk of complicated grief, and complicated grief predicts later increases in alcohol dependence and smoking (Parisi and colleagues, 2019). A survey of 1,529 bereaved adults found prolonged grief disorder independently raised the odds of problematic drinking (Bottomley and colleagues, 2025). Most of this evidence is cross-sectional. It shows association, not the direction of cause.
- Avoidance predicts prolonged grief. In a one-year study of 291 bereaved people, anxious avoidance at the start predicted more prolonged grief, depression, and post-traumatic stress a year later, but only in people within their first year of loss (Boelen and Eisma, 2015). This is the strongest support for the idea that numbing stalls the floor. It is moderate evidence, and it is time-limited.
- Bereavement raises drinking in a subgroup. Mainly men, mainly prior heavy drinkers, mainly in the first two years (Pilling and colleagues, 2012; Stahl and Schulz, 2014). One study of widowers found more hazardous drinking than in married controls, but the drinking was not correlated with grief intensity (Byrne, Raphael and Arnold, 1999). That null result speaks against a simple story.
- The rebound exists but is modest. Alcohol lowered anxiety only marginally in a naturalistic experiment, while next-morning anxiety rose significantly in shy drinkers (Marsh and colleagues, 2019). Laboratory support for alcohol relieving negative mood is weaker than most people assume (Sayette, 2017).
- The rising floor with repeated use is theory in humans. The allostasis model of addiction, in which repeated use shifts the emotional baseline, is well supported in animal work (Koob and Le Moal, 2001) but has weak longitudinal support in humans.
- No study has measured grief trajectories in drinkers versus non-drinkers. A search for one found none. Chart 2 is therefore a hypothesis drawn in the shape of a graph. It may be right. It may be wrong about the magnitude, the timing, or both.
One more finding matters for the other side of the argument. The old idea that you must confront and express grief to recover, the grief work hypothesis, has weak support (Stroebe and Stroebe, 1991; Bonanno and colleagues, 1995). People who took breaks from their grief did not develop delayed grief later. So the lesson of chart 2 is not "feel everything all the time." It is that chemical numbing on demand is a different thing from taking a rest.
5. Managing the pain: what follows from the curves
None of this is treatment advice. It is what the shape of grief suggests about living with it.
- Expect waves, and know that a wave is not a setback. A strong wave in month nine is part of the typical course. Its height says nothing about how you are doing. The floor between waves and the time between waves are the better measures.
- Alternate, on purpose. The best supported model of healthy grieving describes an oscillation: hours of facing the loss, hours of getting on with life, and back again (Stroebe and Schut, 1999). Rest from grief is not avoidance. Chemical numbing every time a wave comes is.
- Rate the pain once a day. A 0 to 10 number in a notebook for six weeks shows you your own floor and your own wave pattern. Most people are surprised by how much the floor has already dropped, and by how the waves cluster around triggers they can name.
- Watch the dip and spike pattern. If a substance brings relief and the pain after it wears off is higher than before, you are looking at chart 2 in your own life. That pattern is the earliest warning, well before quantity becomes a problem.
- Know the two thresholds. If the floor has not eased at all by six to twelve months, if daily functioning remains impaired, or if drinking or other substance use has escalated, ask a clinician for an assessment. Prolonged grief disorder is a recognized diagnosis, and structured professional help for it exists.
- If you are in danger, act now. If you have thoughts of ending your life, contact your local emergency number or a crisis line today. Grief with such thoughts is an emergency, not a phase to wait out.
6. Questions for anyone who has sat with grief
These charts will teach better once experienced people have argued with them. If you are a bereavement counsellor, a palliative care or hospice worker, a clinician, a researcher on grief or addiction, or someone who has lived through a loss, four questions:
- Are the wave frequencies realistic: near daily in the first weeks, weekly by month three, every few weeks by month twelve?
- Does the floor of typical grief ease as drawn, from around 6 at month one to around 2 or 3 at month twelve?
- Does the numbing model in chart 2 match what you see in practice, especially the rising floor in complicated grief?
- What would make these charts more useful for people who are grieving now?
Reply in the comments or by email. A revised version will be published with the changes, and everyone who contributed will be credited.
Conclusion
The pain of loss has two parts that behave differently. The waves stay strong for a long time and are not under anyone's control. The floor between them is where the year's work happens, and it is the part that numbing damages. Manage the floor: alternate between facing the loss and living, watch your own numbers, and treat a floor that will not move as a reason to ask for help. Leave the waves their height. They are the price of having loved someone.
Evidence and scope note
This is an educational Review & Opinion article, not a systematic review, clinical guideline, treatment recommendation, or diagnostic tool. The three charts are schematic models on a self-rating 0 to 10 scale; they are not measured data and not a validated grief instrument. Chart 2 in particular is a hypothesis. The diagnostic descriptions follow ICD-11 and DSM-5-TR for prolonged grief disorder; a chart cannot support an individual diagnosis. Any person at risk of harm, and anyone whose substance use has escalated, needs the emergency, medical, psychiatric, or addiction-care route first. Local clinical, safeguarding, legal, and institutional decisions remain with appropriately qualified and responsible authorities.
Selected sources
- Parisi, A., Sharma, A., Howard, M. O., Blank Wilson, A. The relationship between substance misuse and complicated grief: A systematic review. Journal of Substance Abuse Treatment 103, 43-57 (2019).
- Bottomley, J. S., Williams, J. L., Pavlacic, J. M., Gex, K. S., Rheingold, A. A. Bereavement and problematic alcohol use: Prevalence and predictors among a national sample of bereaved adults. Alcohol: Clinical and Experimental Research 49(1), 175-184 (2025).
- Boelen, P. A., Eisma, M. C. Anxious and depressive avoidance behavior in post-loss psychopathology: A longitudinal study. Anxiety, Stress, and Coping 28, 587-600 (2015).
- Boelen, P. A., van den Hout, M. A., van den Bout, J. A cognitive-behavioral conceptualization of complicated grief. Clinical Psychology: Science and Practice 13, 109-128 (2006).
- Stroebe, M., Stroebe, W. Does "grief work" work? Journal of Consulting and Clinical Psychology 59, 479-482 (1991).
- Bonanno, G. A., Keltner, D., Holen, A., Horowitz, M. J. When avoiding unpleasant emotions might not be such a bad thing: Verbal-autonomic response dissociation and midlife conjugal bereavement. Journal of Personality and Social Psychology 69(5), 975-989 (1995).
- Stroebe, M., Schut, H. The dual process model of coping with bereavement: Rationale and description. Death Studies 23(3), 197-224 (1999).
- Byrne, G. J., Raphael, B., Arnold, E. Alcohol consumption and psychological distress in recently widowed older men. Australian and New Zealand Journal of Psychiatry 33(5), 740-747 (1999).
- Pilling, J., Konkolÿ Thege, B., Demetrovics, Z., Kopp, M. S. Alcohol use in the first three years of bereavement: A national representative survey. Substance Abuse Treatment, Prevention, and Policy 7, 3 (2012).
- Stahl, S. T., Schulz, R. Changes in routine health behaviors following late-life bereavement: A systematic review. Journal of Behavioral Medicine 37(4), 736-755 (2014).
- Marsh, B., Carlyle, M., Carter, E., Hughes, P., McGahey, S., Lawn, W., Stevens, T., McAndrew, A., Morgan, C. J. A. Shyness, alcohol use disorders and "hangxiety": A naturalistic study of social drinkers. Personality and Individual Differences 139, 13-18 (2019).
- Sayette, M. A. The effects of alcohol on emotion in social drinkers. Behaviour Research and Therapy 88, 76-89 (2017).
- Koob, G. F., Le Moal, M. Drug addiction, dysregulation of reward, and allostasis. Neuropsychopharmacology 24(2), 97-129 (2001).
- World Health Organization. ICD-11 for Mortality and Morbidity Statistics, 6B42 Prolonged grief disorder. American Psychiatric Association. DSM-5-TR, Prolonged grief disorder (2022).